What You Should Be Measuring
The first screen on any web analytics package is visitors over time. That’s a horrible graph! Traffic over time is really produced by two forces, new visitors and stickiness. These two forces are what really matter.
Stickiness
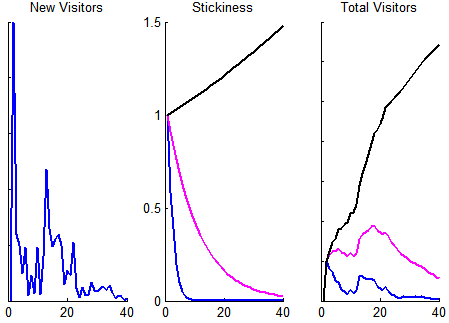
The left and right graphs below are the familiar visitors over time. The middle graph is stickiness; it says how long the average user continues to visit. For example, the blue line expresses that five days after their first visit, only 10% of users are still coming back. The magenta line is better; five days after their first visit, 70% of users are still visiting.

Three Web Sites
Imagine three web sites – blue, magenta, and black.
Blue is a photo social networking site that requires visitors to sign up before seeing anything. The average new visitor sticks around for 0.13 days, so their Total Visitors closely resembles New Visitors. A couple days into launch they meet with investors and yell “Look! We’re getting loads of traffic!” The traffic is all from Digg, TechCrunch, and Reddit, though; pretty soon they will be old news and their traffic will die, as seen on the Total Visitors graph.
The best stickiness you can get is a constant 1.0, right? Then you would retain all of your traffic and total visitors would be the integral of all new visitors over time. [1]
No, you can do better! Black is facebook. Not only does the average new visitor stick around, but she brings friends and your traffic explodes! (2009 update: the cool kids are now calling this a "viral coefficient".)
The median web site is actually worse than all three shown here. The median TechCrunch'ed web site will have 5% of new visitors show up the next day. It's a sad state of affairs.
The Secret
The secret is that New Visitors aren’t that hard to come by. If you’re a startup building a web site, you can get coverage on blogs. If you have the right luster you can get on Scoble, The Today Show, and ABC Nightline. If you’re in a boring market then you can use adwords. If you’re competing with Girl Scout cookies then you can hang a sign outside the Safeway.
It’s easy to get excited by huge traffic spikes when you first launch. You haven’t accomplished anything, though; tomorrow the spotlight will be on another startup. You need both new visitors and stickiness to build a successful business. Stickiness is harder to get, but nobody measures it!
What This Means
All subscription businesses run on one metric – Average Revenue Per User (ARPU). [2] When a decision is to be made, the first question to ask is How will this affect our ARPU?
If you’re building a web site, stickiness should be your key statistic. You should write code to measure it before launching. After you have launched, put it on an LED display outside your elevators.
Announce it at all of your meetings. When making a decision, ask How will this affect our stickiness?
And actually measure and follow up! You make what you measure.
Stickiness Built In
Some products have stickiness built in. Social networks encourage you to bring in your friends. Desktop applications have a persistent presence after being installed, so the user doesn't have to remember a web site name. PayPal has some of your money in your PayPal account, so of course you'll come back. Interesting writers like Joel on Software or Paul Graham promise to give you new thoughts occasionally, so you're compelled to always come back. And so on.
So, how can you make yourself stickier?
Notes
[1] The math is simple; total visitors is just the convolution of new visitors and stickiness. For those who had the delight (or misfortune) of a Signals and Systems class in college, this is just a system where new visitors is the input and stickiness is the impulse response.
[2] Thanks to Joe Kraus for the example.